Ticket Volume
Review how many requests are being created and how activity changes over time.
Turn everyday IT activity into clear management visibility through graphical analysis of tickets, assets, services and costs.
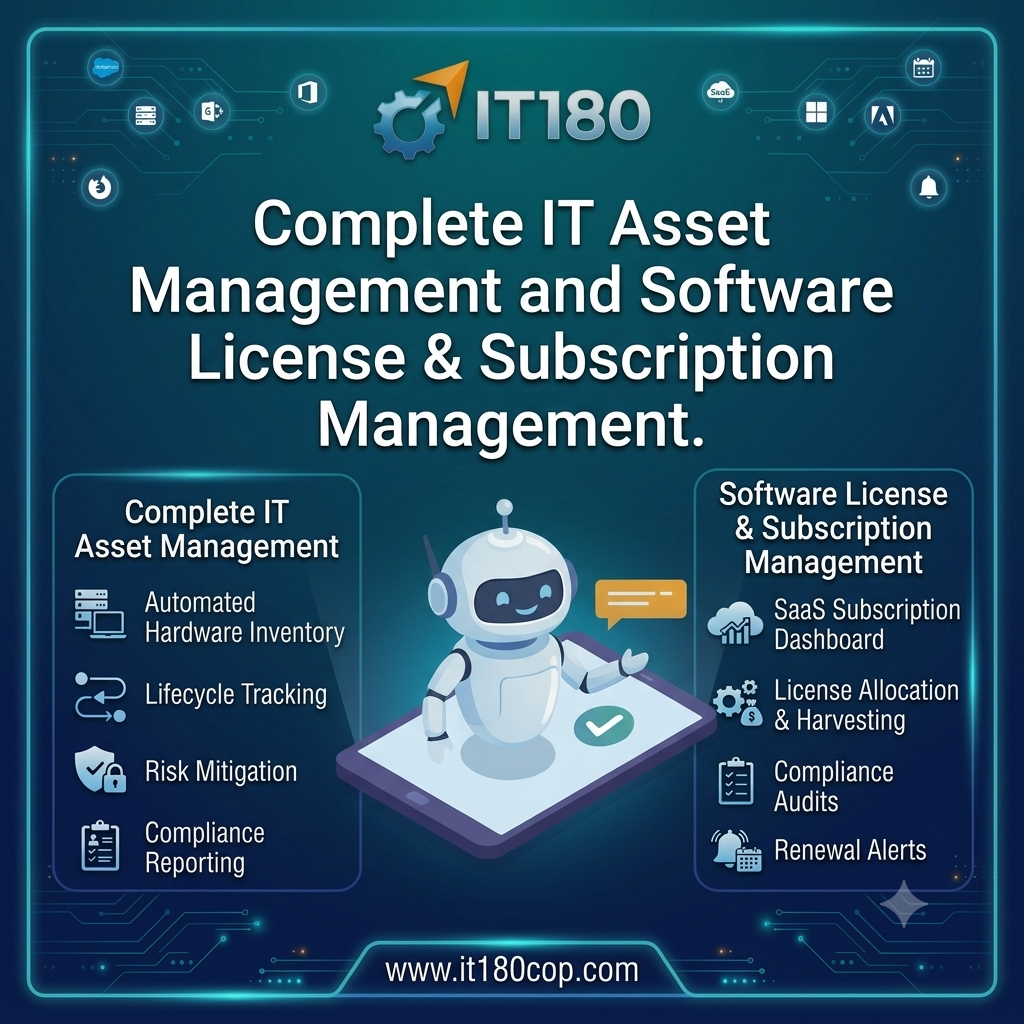
The dashboard concept is designed to give leadership a faster way to understand IT operations.
Review how many requests are being created and how activity changes over time.
Identify recurring issues that may require a deeper operational response.
Understand the cost involved in solving IT requests and maintaining infrastructure.
Review how IT assets are being purchased and how investment changes over time.
Monitor software and service commitments across different periods.
Use daily, monthly and yearly views to identify patterns and trends.